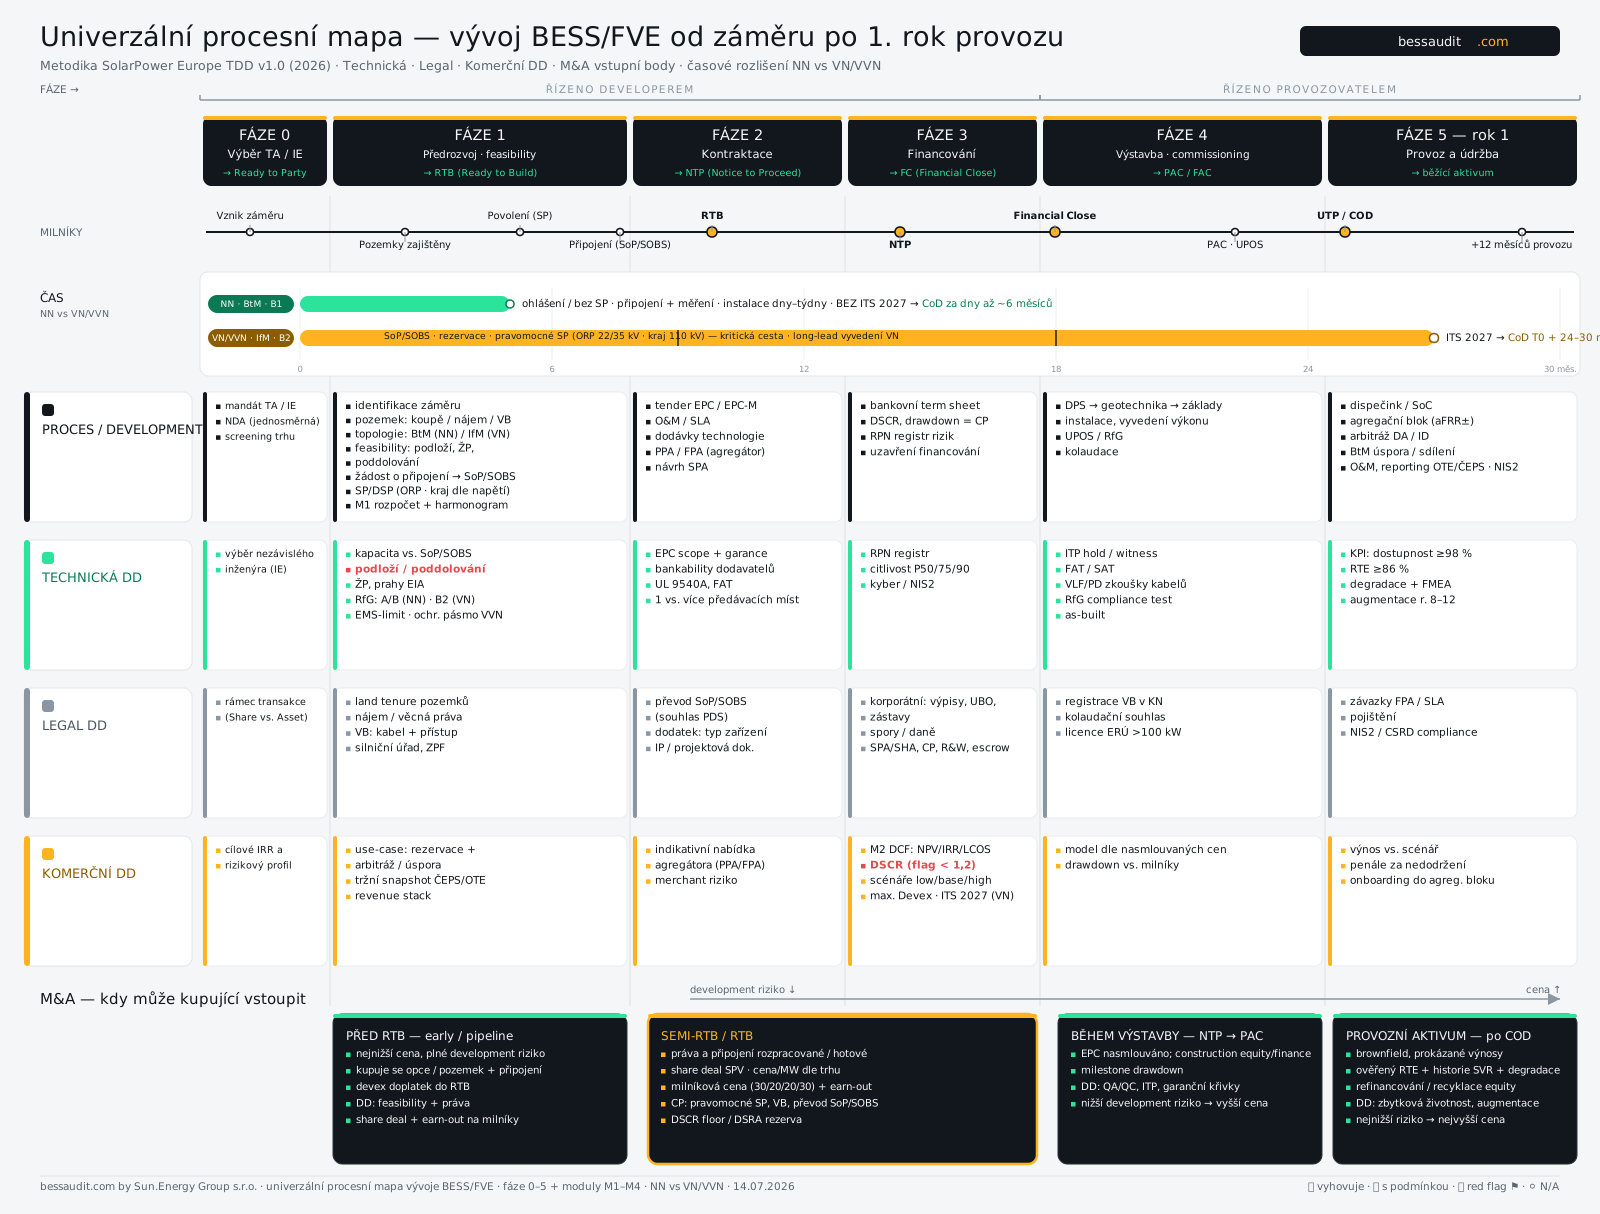
A battery storage or solar project runs through six phases and roughly thirty months. Here is the whole journey in one picture — where the milestones are, what gets checked in each phase and when a buyer can step in. The detailed methodology is in the Methodology; specific questions are answered in the FAQ.
Horizontally you have the phases — time runs left to right, from the first idea to the twelfth month of operation. The arrow after each phase is a milestone that shows the phase has genuinely closed (RTB, NTP, Financial Close, PAC, CoD). Vertically you have the four review lanes: what happens in the project itself, and what goes with it technically, legally and commercially.
What actually happens in the project: land, the grid connection application, permits, the EPC tender, financing, construction, dispatch.
Capacity vs. the connection agreement, subsoil and undermining, RfG category, EPC guarantees, testing, availability and efficiency KPIs.
Land tenure and easements, transfer of the connection agreement, corporate review, SPA/SHA, the ERÚ licence, NIS2 and CSRD.
Use case and revenue stack, the aggregator's offer, merchant risk, DCF with DSCR, low/base/high scenarios, the 2027 tariff structure.
Below the phases sits the timeline in two bands, because development time follows the voltage level: a behind-the-meter LV installation is a matter of months, while an MV/MV project runs for about two and a half years, with the final building permit and the power export route on its critical path. The last block of the map — the buyer's entry points — shows that the price of a project rises exactly as its development risk falls away.
The advisor's mandate, an NDA, market screening and the topology decision: a behind-the-meter LV battery, or a utility project on MV. This is also where the target IRR and risk profile are set — without them there is nothing to measure against later.
Land, the connection application and agreement, permits according to voltage level, subsoil and the environment. The longest and riskiest phase — and the only one where stopping the project is still cheap.
The EPC tender, the O&M contract, technology supply and the agreement with an aggregator or offtaker. What gets checked: scope and guarantees, supplier bankability, and who carries which risk.
The term sheet, drawdown conditions, the risk register and sensitivity analysis. The decisive figure is DSCR: a minimum annual debt service coverage below 1.2 is always flagged as below the threshold, even when every other indicator looks good.
The inspection and test plan, cable testing, the RfG compliance test, as-built documentation and the occupancy permit. Funds are drawn against milestones, not in one payment.
Dispatch and state-of-charge management, joining an aggregation block, day-ahead and intraday arbitrage, reporting to OTE and ČEPS. Watched: availability above 98 %, round-trip efficiency and degradation — with augmentation typically planned for years eight to twelve.
An acquisition is not a single moment. The map distinguishes four entry points, and the same law holds at each: the less development risk the buyer takes on, the higher the price they pay.
| Entry point | What is bought | Price and risk | What the review looks at |
|---|---|---|---|
| Pre-RTB early / pipeline | An option or land with a connection, plus the Devex top-up to RTB. | Lowest price, full development risk. | The feasibility study and land rights; a share deal with an earn-out on milestones. |
| Semi-RTB / RTB rights in progress | An SPV with completed or partly completed rights and a connection. | A market price per MW, paid against milestones. | The final permit, easements, transfer of the connection agreement, the DSCR floor and the debt service reserve. |
| During construction NTP → PAC | A project with EPC contracted and financing secured. | Lower risk, higher price. | Build quality, the inspection and test plan, guarantee curves. |
| Operating asset post-CoD | A brownfield asset with a proven revenue record. | Lowest risk, highest price. | Verified efficiency, ancillary service history, degradation, remaining life and augmentation. |
The platform does not do everything on the map — it does the part that can be computed from data, and it does it the same way every time. The rest is human work, and it is clearly priced as such.
An indicative assessment from your inputs and public data. It answers whether it is worth going further. Typically in phase 0.
A business case with the revenue stack, tariffs and a DCF in low/base/high scenarios. Phases 0–1, or before pricing an acquisition.
A red/green go/no-go review: the quick check, critical findings and a snapshot of the investment recommendation and rights.
All five phases and four modules, each phase with its checklist table and critical findings. For the transaction and for the bank.
What each level includes and what it costs is in the the price list. The methodological basis — how the revenue stack, network charges and DSCR are calculated — is described in the Methodology.
Your battery, audited. In minutes, not months.
Enter an address, an invoice or documentation — the platform builds a business case, revenue stack and due diligence from real market data. First output free.